
The Reconfiguration Tool in CET Designer is a fast and easy way to manage inventories and reconfigurations of complex facilities. It is easy-to-use, with basic graphical representations in flowchart form that allow you to compare different scenarios for reconfigurations to optimally reuse existing installed and warehoused products. It is also an evolving document that helps you to keep track, over a period of time, of where products are installed or warehoused. All inventories are kept as a part of the evolving and growing flowchart for future consideration. This tool considers both CET Designer drawings and PM SIF files, and allows you to prioritize pulling items from certain locations.
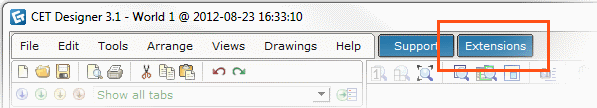
The Reconfiguration Tool is a separate Extension which is downloaded free of charge from our website. To access the Extensions page, you just click the Extensions button in the program window:
After installation, you launch it by clicking the Start Reconfiguration Tool button on the Reconfiguration Tool component tab. This opens a new window with a pre-made flowchart.
When saving a reconfiguration chart, a separate file with the suffix .cmrcf is created. This file can be opened without access to the drawing files that were originally loaded in the chart.
Note
|
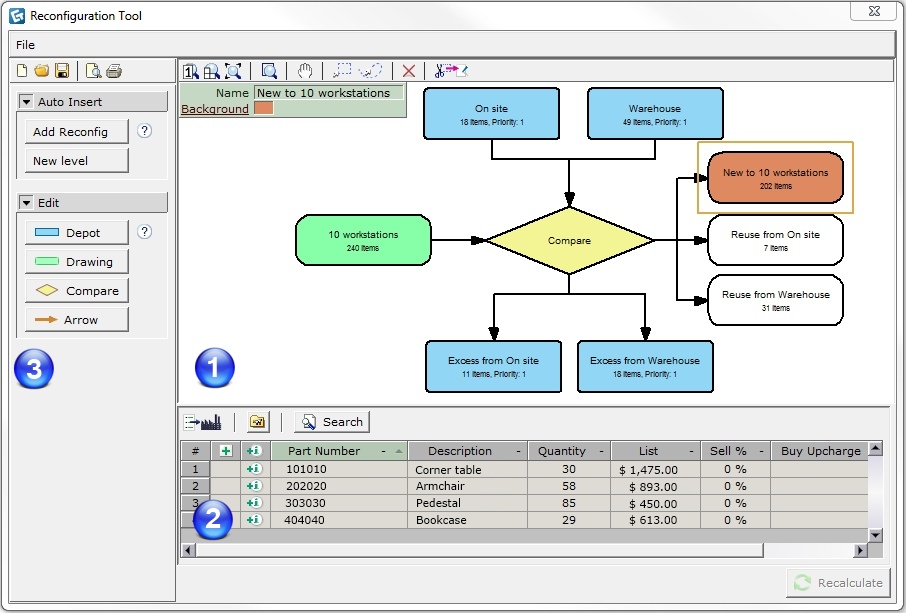
The top half of the window displays the flowchart while the bottom half shows a calculation view listing all the articles within a selected block, as in Figure 1 below.
 |
Reconfiguration flowchart |
 |
Calculation view for the selected block |
 |
Menu |